
City Budget Proposal Centers Fiscal Uncertainty
City Budget Proposal Centers Fiscal Uncertainty
FY25 STL Budget Proposal Review and Commentary


It’s April, which means that baseball is back and it’s also time for the city to roll out its annual draft budget. Given the likelihood of the loss of Earnings Tax revenue from remote workers and the continued spend down of pandemic-related monies, this year’s budget is likely a view into the city’s medium term fiscal picture. After years of being bolstered by the twin engines of pandemic-era stimulus spending and skyrocketing Use Tax revenues (due to the state beginning to allow collections on internet purchases), we’re now entering into an era of decreasing federal support and flattening growth on combined Use and Sales Tax revenue streams. If you’ve never read one of my budget document reviews, note that this is sort of intended for an audience with an intermediate level of knowledge about the city’s functioning. I try to cut through a lot of the fluff to pull out the most salient points. I don’t go into a lot of things the document brings up about individual projects, keeping more to general trends in revenue and spending categories. If you want that fine level of detail, I hope you take the time to read the full FY25 draft budget document.
Budget Director Paul Payne is upfront about the likelihood of the Earnings Tax/Remote Worker-related losses to revenue, and the draft budget includes a contingency plan to cut $26M in spending, in the eventuality that this revenue is no longer collectable. As the document states, much of the spending reduction will be achieved by cuts to potential city work salary increases and the consolidation of positions, therefore reducing the total number of allocated city worker positions by an estimate of 60 positions. Given the current, still-inflationary economic environment, it is likely that this will further complicate the city’s long-running inability to fill positions. Given that potential, it is unlikely that city residents will see improving services. Some departments may make improvements, but it will be hard for the city to improve things broadly, while essentially locking in workforce reductions via consolidation and salary-driven difficulty in hiring for many positions.

On the other hand, revenues are continuing to outpace last year’s projections, which has led to some surplus funds. It is less clear how meaningful these surpluses are, though. Given continued elevated inflation, it is possible that much of this surplus revenue is being offset by increases in the prices that the city pays for goods and services. One point of concern that Payne addresses is the slowing of increases in Sales Tax revenues, which only increased by 0.6%. After noting this slowdown in Sales Tax revenues, Payne highlights the aforementioned increases in Use Tax revenue. This will be important, as we’ll later discuss how this increase in Use Tax revenue is being opened up to more and more departments. While the fund was originally intended to fund affordable housing and public health needs, it has long been used as a pot of monies that successive administrations have drawn from to fund any number of priorities. This year’s budget continues that tradition, reducing affordable housing spending and sending the money departments that previously didn’t use this funding stream. Payne does note that it is expected that economic growth will slow in the coming fiscal year and states that the budget proposal takes this into account, though it doesn’t contemplate a more serious recessionary period. Payne address this toward the end of the Executive Summary introduction.
“The proposed FY2025 Annual Operating Plan totals $1,334.1M. This is nearly flat with an increase of 0.4% from the previous fiscal year. The City’s general fund, the largest component of the budget, provides funding for the majority of City services and totals $580.9M. This is an increase of 2.5% from the prior fiscal year. Revenue estimates assume a modest amount underlying growth though at the same taking into account contingency reductions in Earnings and Payroll taxes.”
Service Area Budgets
Moving on from the generalized, “top line” analysis of the introduction, the budget proposal gets into more specific looks at areas of city services and how the proposed budget would fund them. First off, we get a look at the “Safe Neighborhoods” service area. This section includes funding for SLMPD, STLFD, the Civilian Oversight Board (COB), the Office of Violence Prevention (OVP)and other entities that contribute to public safety. According to the draft, SLMPD funding is going to stay relatively flat at $226M.
When we move over to the OVP’s budget, we see that ARPA funding is now being replaced by local revenues. Specifically, the city is picking up the bill for an additional $5.2M in what it says are mostly contracted services that were previously funded by ARPA monies. I believe this is the first part of the document that specifically calls out ARPA funding fading and the need for the city budget to pick up those costs, at least if the programming is to continue. This is also the first place where we see the city is specifically choosing to fund a big of this shortfall by taking monies from the Use Tax funds.
The document then turns to the COB. I doubt that it surprises anyone to see the administration making some cuts in this area.
“The budget for the Civilian Oversight Board of the Department of Public Safety will total $1.2M in FY2025 which includes 19 positions to provide support legal investigative and administrative support staff. With an existing number of vacancies, this funding and staffing is slightly lower than the current fiscal year.”
After this, the budget document turns its attention to the Fire Department and Corrections. For STLFD’s part, the draft budget envisions a modest increase of 1.2%, while corrections, the draft budget calls for $3M reduction in spending. $2M of this decrease is due to medical costs being split off . We’ll see where this new allocation’s funding is coming from at a later point. That still means real cuts will be made. This is despite the fact that the same document notes that our local inmate population has risen from an average of ~550 in the most recent year to a current level of an average of ~650 inmates. The document notes that this reflects a cut of 65 correctional officer positions. Given the well-documented struggles at the Justice Center, it is pretty surprising to see said cut in the budget. The document says that this new proposed staffing level is reflective of current operations. Given the poor state of current operations, this essentially means that the poor treatment and deaths that plague the city’s correctional system are likely to continue.
Lastly, the draft summary notes a ~$450k reduction in the Public Safety Director’s office, which it says reflects unfilled contractual services offerings from the prior year.
Parks and Recreation
The document notes that the Forestry and Parks divisions will see budget increases. For its part, the Forestry Division is slated to receive an additional $1.4M in funding that is says is largely due to the increased pay for the weed, debris and tree trimming crews, as well as an increase in the amount budgeted for private contractors doing similar work, which the document notes the city is becoming increasingly reliant. When we switch over to the recreation side of things, the budget envisions a largely flat funding level. It does note additional capital improvement monies that will be coming to the department, as well as some additional funding for mowing services.
Affordable Housing Funding
One of the more incredible things in the current year’s document is that the Affordable Housing Trust Fund (AHTF) spending from the Use Tax fund will remain essentially flat (6.5M), though total funding will see a slight decrease. This is especially sad, given the continually escalating affordable housing crisis. In a kind of sad attempt to downplay this egregious decision, the document plays up ARPA monies that have already been spent in the previous FY. Given that those expenditures haven’t really changed the city’s affordable housing situation, their usage as a “fig leaf” is one of the document’s rhetorical low points. To give folks a little more perspective, the AHTF’s total FY22 budget was $7.9M, while the new draft budget is sending $6.8M to the AHTF. That means that funding in absolute dollars has fallen by about 14%, all during our current period of fairly unprecedented increases in cost of living. Adjusted for housing cost inflation over that period, the proposed funding level is functionally around a 30%-35% decrease in affordable housing funding, when compared to the value of dollars in the last Krewson/first Jones budget. Due to the vagaries of election and budgetary process timing (elections in April with the budget needing to be approved by July 1st), the first year of a new administration’s budget was largely assembled under the previous administration’s time in office. Since the FY22 budget was Jones’ first as mayor, it’s really as much Krewson’s budget as Jones. The same would be true of a successor, in the event Jones isn’t reelected. They will be sworn at about the same time as when the draft budget is made public, meaning that it’s not really something the incoming mayor has had a ton of influence over. This is very much in conflict with the narrative and framing of the Jones administration, as the mayor campaigned on big expansions in affordable housing spending. While the administration has taken steps to deepen affordability at some new projects, this drawback in funding shows that affordable housing funding isn’t an administration priority. This is especially the case, when considered alongside the fact that other departments and offices are being added to the list of entities drawing funds from the Use Tax, which is the AHTF’s main source of local funding. To give a bit more context, I would point out that this decline in dollars sent to the AHTF happened as Use Tax revenues have surged by close to 80% over that time spanning FY22 to the currently proposed FY25 budget.
Transportation
Under the heading of Efficient Transportation, the budget discusses various bridge and road improvements, often made with additional ARPA and/or state funding. It also takes time to highlight the terrible Louisiana Calm Streets project that has made driving in the Gravois Park/Dutchtown area more annoying, while mainly leading to lots more crashes, due to the “roundabouts”, which are really just smaller Shoemehl Pots. It then discusses some new cyclist infrastructure planned for Tucker and S. Broadway. There’s also a lot of talk about speed bumps, bridge replacements, etc. All in all, the document indicates that the streets department will see over a million dollars in new funding, split between various line items.
Refuse Division
If you’re like me, you haven’t had consistent trash pickup since the last Slay term, which means that we’re quickly nearing a decade. Remember when they just didn’t buy new trash trucks for a decade, because Slay wanted to privatize it on the way out? That was when it all began. Since then, trash service has worked in fits and starts, but it has remained irregular and insufficient. It’s pretty incredible to think that city services have been failing for that long of a time, but it took a long time and a lot of effort to get to this state of dysfunction.
The Refuse Division began the current fiscal year under a new waste disposal contract which increased the overall per tonnage fees of municipal solid waste. Where in prior years the City had either received revenue from recycled waste or disposed of it at a reduced cost, the cost of single stream recycled waste exceeded the cost of regular waste for the first time in FY2023. Under this new disposal contract initiated in FY2024, this trend was set to accelerate. While Refuse disposal costs had been expected to S-14 increase by as much as $3.6M or 45% over the prior fiscal year…
Looking ahead to FY2025, costs have been budgeted at $10.1M. This is about $1.4M less than the original budget for FY2024 but $700,000 higher than the revised projections and far outpacing the revenue from the monthly refuse collection fee.
That bit about recycling costs is something, seeing as we don’t really seem to have a functional recycling system. Without regular trash service, people are going to keep throwing trash in the blue bins. That’s just reality. Until we get the main trash service fixed, we should expect poor recycling performance. Still, that it’s gotten so expensive is pretty odd.
Health Department
The city notes that the Department of Health has seen an increase in calls from residents seeking mental health and/or substance abuse counseling has risen by 100%-150% in the past year. This isn’t too unexpected, as this program only began in 2023. As such, it is natural that usage would increase over the first few years. It could mean that residents are having more behavioral health struggles, or it could also mean that this new resource is meeting pre-existing community needs. This document isn’t really instructive as to which is actually happening. The document notes various things that are getting certain amounts of funding (including some numbers on increased budget lines), but there isn’t really a total change in budget number offered in the summary. This could be due to the fact that so much of this spending comes from federal monies.
Pension Costs
There’s not a ton in this section. The opening sentences tell you the most important part.
The costs of the City’s four pension systems saw a significant increase in the prior year reflecting the projected costs of the higher uniformed employee pay plan. In FY2025, in all funds, pension costs will collectively rise by $1.8M.
It shouldn’t surprise anyone that follows local coverage that some of this increase is being attributed to the firefighter pensions, which have been in the news quite a bit for changes that overcame the mayor’s veto. It does also indicate that the Employee Retirement System that covers non-public safety employees is also seeing greater need for support from the city’s budget. While it doesn’t state it clearly, it would seem that most of the rise is actually due to the increase in payments to the ERS, as the two firefighter pensions are only credited with a combined increase of $0.3M. This increase in support to the firefighter pensions is offset by a $0.3M decrease in police pension contributions. This would indicate the increased ERS contributions account for almost all or all of the net increase in budgetary pension contributions. If that’s the case, it makes a lot of the drama around the recent firefighter pension changes seem quite odd.
Reserves In Good Shape
One thing that the Krewson administration focused on was the rebuilding of the city’s emergency reserve fund. This has continued under the current administration. At this time, it looks like we’re in pretty decent shape. From the draft proposal’s summary:
The City has continued to make progress in improving its level of unrestricted budget reserves. At the beginning of FY2024, the reserve level on a cash basis stood at $127.4M or 22.5% of the FY2024 general fund budget. The Government Finance Officers Association (GFOA) has recommended that governments maintain a minimum unrestricted general fund balance of no less than two months (16.7%) of the operating budget. The City meeting and exceeding this minimum target was a major milestone in ensuring the City’s fiscal resiliency. Reserving and maintaining a healthy fund reserve remains an essential part of the City’s effort to ensure it is prepared to weather periods of economic uncertainty.

This is seriously good news for us. Doing this was an important step toward getting us on the path to getting our credit rating raised and stabilized. In this era of increased borrowing costs, better ratings are even more valuable. This was something that the Slay administration just let degrade to an irresponsible degree. That the two following administrations have reversed his mistake and brought us into line with generally accepted fiscal standards is a step forward for the city.
Our Mysteriously Expensive Board Of Alderman
One of part of the budget that has ballooned, with scant evidence of improvement, is the Board of Aldermen. While regular citizens continue to face inadequate service, the alders’ budget has exploded from $3.4M in FY22 to $5.6M in FY25. This is actually a pullback from last year’s $5.9M funding level. I have no idea what this massive increase in funding is supposed to have accomplished. Any impact from this increase in spending is basically invisible to most taxpayers. Those of us who live in lower income areas have mostly seen less of our alders, post ward reduction, as they spend their time in areas with more money and potential campaign donations. As far as I can tell this giant increase was mostly to fund the hiring of people who are friends with both President Green and Mayor Jones. There really isn’t any good excuse for this 65% increase in costs, while the public has seen next to no benefit. Any other department that had seen this big of a budget increase, without much of anything to show for it, would be facing significant aldermanic scrutiny. Of course, that’s not the case, as this money is going to the alders and their support staff.
Where Does This Money Come From?
After getting through the initial summaries, we get to the portion of the budget that discusses the city’s various revenue streams and expense categories. I’m not going to go over all of them, but I will pull a number that I think are interesting or just good information. Luckily, the budget always includes this handy pie chart:
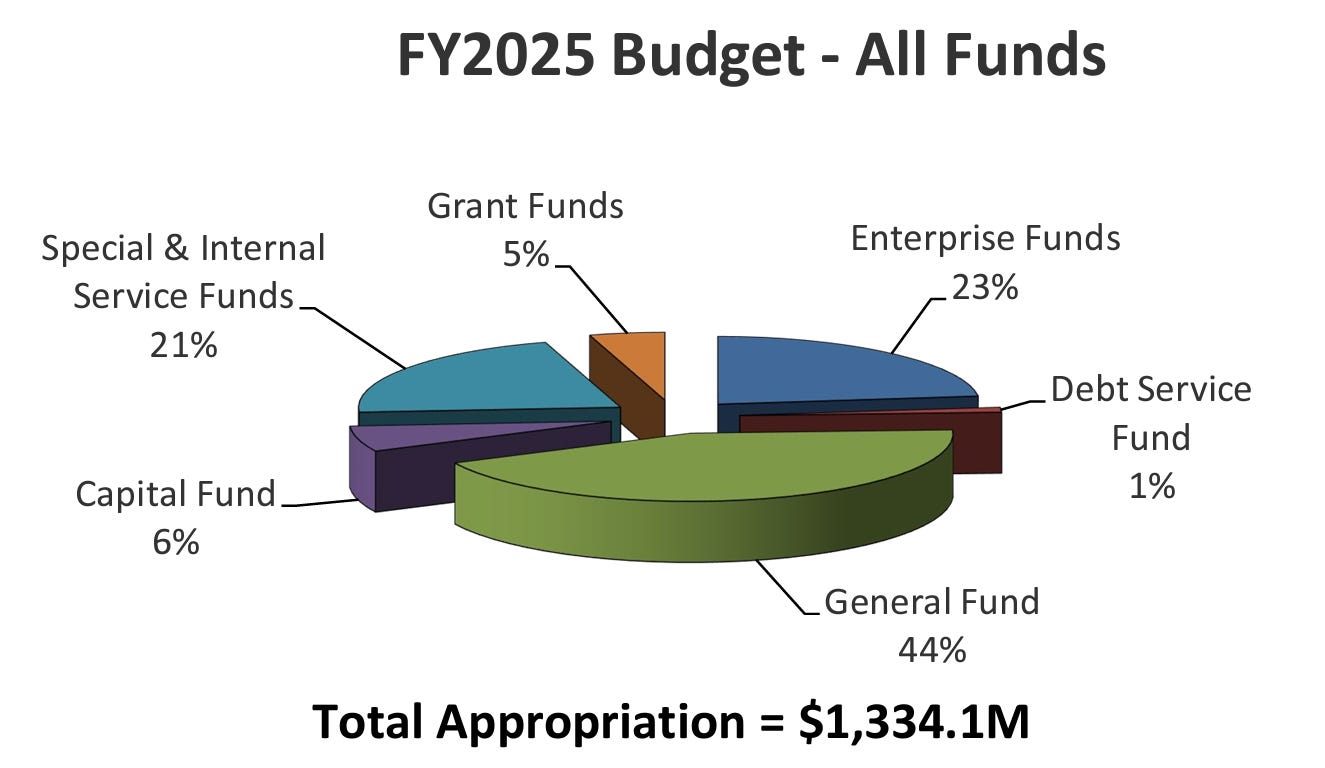
As you can see, the city’s funding comes from numerous streams and the FY25 budget projects spending $1.3B in the coming fiscal year. Here’s a bit of explanation from the draft:
Most local taxes and fees are collected and used to support services in the general fund. The remaining local collections are deposited in special accounts due to legal requirements and are used to augment the services provided by the general fund. These special funds include those containing Local Use Tax proceeds, Public Safety sales tax revenues, Economic Development tax revenues, revenues from gaming operations, the cable television gross receipts tax, the state subsidy for property tax assessment, building demolition, lead abatement, the new economic development sales tax and other special funds.
Performance Of Various Revenue Streams
Moving on in the document, we get to the General Fund Overview, which includes information about the growth or decline of various revenue streams. Here’s the highlights:
Total general revenue has been growing at a healthy clip, though it appears to be slowing. Due to the forecast of further slowing of growth, the city is expecting $581M in general revenue. This will be a decline of roughly $4M, as the current year’s general revenue is project to finish out at $585M
Earnings and Payroll Tax collections are expected to decline, due to the likelihood that either legal or legislative challenges to the city’s policy of continuing to collect these taxes on remote workers will mean these workers will no longer be part of the city’s taxable worker pool. This would mean a commensurate loss to the payroll (employers’ portion) taxes as well. This has gotten a good amount of local press attention. There’s also mention of a one-time TIF-related cost to this revenue stream. All-in-all, the city plans for a loss of $26M in funding from these tax streams.
Property Tax collections continue their pace of healthy growth. These clock in at a 10.6% growth rate for real estate taxes and 6.6% growth in personal property taxes. The budget document specifically calls out inflation and the related increase in state COLA calculations for allowing this rate of growth. This is a reminder of the Hancock Amendment’s role in setting local millage rates. This budget, probably due to the forecast of a slowdown, envisages a slower rate of growth (2%) in FY25. Frankly, I’m kind of surprised that this part of the budget makes no mention of empty office buildings and potential falling commercial assessments in downtown’s central business district.

Sales Tax collections are a down note. While growing, the collections are growing at a far slower rate than the rate of inflation. A large part of this is the switch to online sales, which means that those purchases are now creating revenue under the city’s Use Tax, instead. The document foresees a continuation of slow growth in this revenue stream. It does note a projection of the $2.4M in FY25 revenue from the new recreational marijuana sales tax.
As has been mentioned, the revenue being generated by the Use Tax has skyrocketed. That being said, it is now being split between more entities than ever. While the amount of money flowing to the fund has been rising, the AHTF hasn’t been seeing increasing funding. Instead, we’ve seen increased funding to deal with things that tend to come downstream from housing instability. This year, the number of departments and offices that receive more money from the Use Tax, compared to the AHTF, has continued to increase. For instance, the Office of Violence Prevention is new to accessing this funding stream. In it’s first year, it will receive roughly $750k more than AHTF. In addition to that increased Use Tax spending on public safety, this year brings a $4M increase in Use Tax funding to SLMPD, bringing their annual funding from this revenue steam to a hair under $24M. This doesn’t include the $2.6M in Use Tax funding that is being dedicated to the SLMPD pensions for a second year in a row. For their part, the firefighters pensions are getting $650k for a second year. This year also uses $2M to fund inmate healthcare, which is probably the new contract for medical services that was signed for CJC. The office of the Commissioner of Health will also receive close to a million in funding from the Use Tax. Probably the most mysterious addition to the Use Tax funding pool is the Board of Public Service. For unknown reasons, BPS is now getting $2M in funding from this revenue stream. Most of the other line items are fairly close to previous historical funding levels.

Under the somewhat variegated Intergovernmental Revenues section, we see that gas taxes are projected to continue their rise, with an additional $1.4M in projected collections from this stream. At the same time, it notes a 17.3% decline in motor vehicle sales collections during the current fiscal year, with a modest 1.5% increase projected for FY25. It doesn’t really explain why. My guess is that falling used car prices are probably part of the equation. They’ve been declining from pandemic-related highs, and it would make sense that this would impact related tax collections. The city expects to receive reimbursements from the state for housing both adults and juveniles. Adult and juvenile inmate reimbursements are projected to stay flat at this year’s $1.2M mark for adults and $4.3M for juveniles.
Franchise Utility Taxes are collected from the various monopoly utility providers. Electric utility receipts make up over half of this category’s revenue clocked in at $30M per year, which is up at an annualized rate of 6.6%. Most of this increase is attributed to an 8% increase in payments on commercial buildings. Natural gas and steam taxes revenues are projected to rise, but less than current inflation. The budget takes a moment to note the continued decline in telecommunications tax revenue, with a 5% decline projected for FY25. There is also mention of the increases in Water Department bills, which will hopefully help with the capital improvement and maintenance costs that have been put off for some time.
Tourism and amusement revenue streams show uneven growth. Restaurant tax receipts had grown by 4.6%, while hotel tax collections increased by only 2.4%. The budget’s projection of a slower economy brings an expectation that dining and hotel revenues will grow by 1.6% and 1%, respectively.
Under the Other License Fees category, the document mainly notes a 31% decrease in cigarette tax collections. As for Graduate Business License revenue, the city’s current year appears to have reversed the previous budget year’s decline in collections. It projects $6.6M in these fees, which matches the current year’s receipts.
One of the more interesting categories is the Departmental Receipts category, which is sort of a catch-all for other fees. The budget document notes a 23% drop in revenues related to court fines and violations, along with a 16.5% decrease in ambulance billing. The report notes that this is partially due to the fact that private companies have been hired to do some of this work, sending the dollars from those ambulance trip into the private sector. Also in this category is the Building Division permitting revenue, which the budget says has dropped by 25% over the past year. Street Department permitting has also declined by 27%. Offsetting some of these declines, interest income has exceeded expectations. The document doesn’t mention it, but it would make sense that much of this is interest on ARPA and Rams settlement monies that have been sitting in the bank.

That’s All, Folks!
I think I’ve covered the “top line” for the various streams and departments, so that’ll finish up this year’s budget proposal review. I really do think it’s a good thing for folks to read the full document, but I know not everyone want to read the summary document’s 100+ pages. That’s not even including the line item spending, etc. These posts are supposed to get the main points across, but it is up to you to do further research. Hopefully you have found this post informative!