

Changes In City Real Estate Trends
Let's take a look at how different neighborhoods' real estate markets are doing

Readers may want examples of the kind of content that I would be posting at the new site. This real estate article is an example of the data-informed work that I will be posting on non-governmental matters. When we get closer to launch, I will update this and then publish the updated version of this analysis on the site. I’ll also probably try and get quotes from a few Realtors, etc. to include in that final version. I will likely do a companion piece looking at price performance in various parts of St. Louis County.
The larger regional picture
In the past few years, some neighborhoods have seen their real estate markets remain stable or continue an upward trajectory. Other neighborhoods have not had such success. To get a clearer idea on changes in the city’s submarkets, we are using Redfin’s publicly available data to take a look at changes in neighborhood real estate sales prices. Due to it being unfeasible to look at every neighborhood’s real estate market in a modestly-long post, we have chosen some baskets of neighborhoods broken down to groupings of central, northern and southern neighborhoods. Before getting into that, let’s take a look at how St. Louis City’s sales prices are performing, compared to suburban neighbors in St. Louis and St. Charles counties. I’ve also included national prices, so that you can see how the three counties are performing, compared to overall national pricing trends. That is only for this regional analysis, while sub-regional baskets only show local values. Along with the usual north/central/south analysis, we’ll also compare how various higher value neighborhoods are performing, compared to each other. We will do the same for neighborhoods that have been trending upward in recent years.
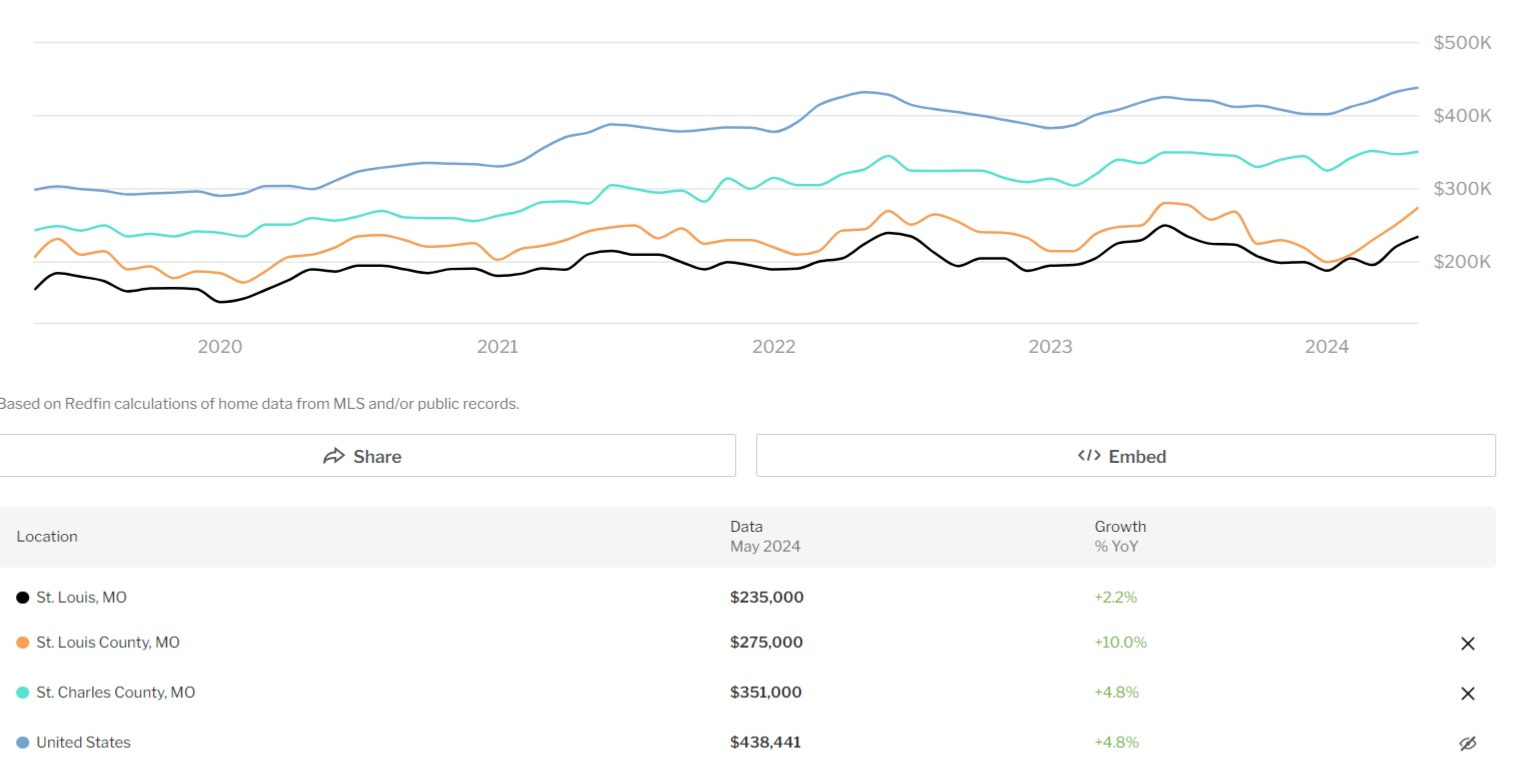
As readers can see, Price growth in the city has been moderating. An even more pronounced moderation trend was also taking place in St. Louis County, though that has recently reversed. After a brief period of time St. Louis Co.’s prices almost fell to even with the City’s. In 2024, St. Louis Co.’s sales prices have regained their premium over the city’s, with recent sales data showing that St. Louis County is actually posting the highest year-over-year (YoY) returns. It is important to note that real estate prices have a good amount of seasonality, so the change from one month to the next is generally seen as less important, compared to the YoY analysis. As you can see from the graph, all three imperfectly track the national trends. In the past year, we can see that St. Charles Co.’s market performance has basically matched national price appreciation, while St. Louis Co. exceeds it and St. Louis City underperforms.
Basket of “up and coming” city neighborhoods
Before we look at neighborhoods in the usual north/central/south frame, let’s take a look at some of the neighborhoods that have seen increased investment and have been touted as “up and coming” neighborhoods. I would point out a couple of features about the graph below.
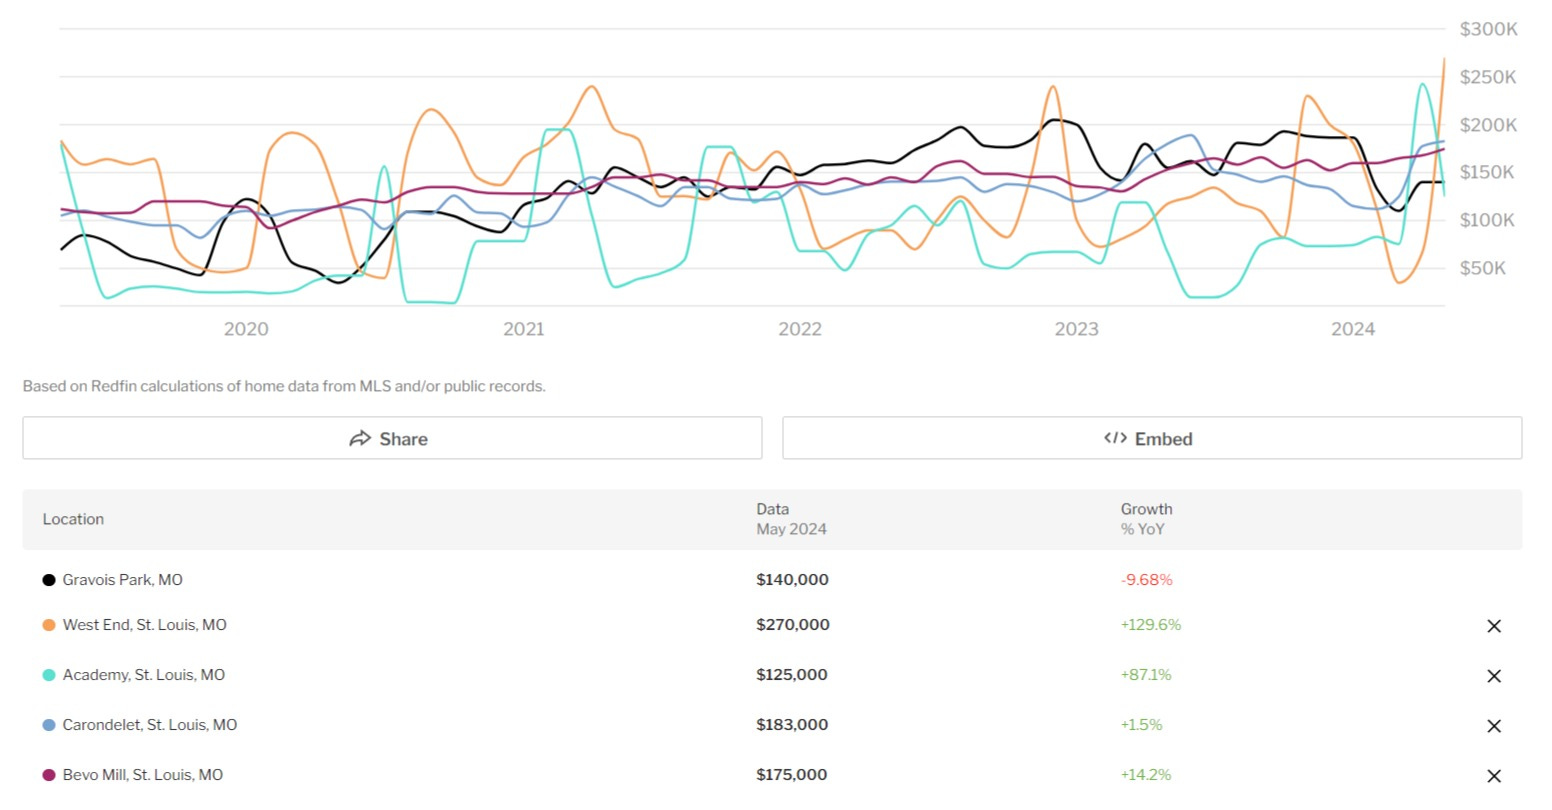
Notice the “spikey-ness” of the numbers from Academy and West End? These sales price behavior in these near northside neighborhoods are experiencing a common phenomenon during the initial years of gentrification. During these periods, you will often see lower prices with these large jumps. This is usually indicative of a slower market where new rehabs are selling. In these markets, you have still-depressed housing values driving sales prices for much of the neighborhood. Meanwhile, blocks closer to wealthier neighborhoods will have rehabbing activity, which generates occasional sales prices far in excess of the pricing for non-rehabbed homes in the neighborhood. Due to overall low sales volume, these sales can create the kind of dramatic swings you see in the data for West End and Academy. Due to this activity the fact that this data came in a month with a large spike, West End’s YoY change appears far more extreme, compared to what your average seller would fetch on the market. In fact, this winter saw West End sales prices dip below recent years’ lows.
The three southern neighborhoods (Gravois Park, Bevo, and Carondelet) show less dramatic leaps and falls, as they have active real estate markets that generate enough transactions to smooth out this or that low or high sale. Until recent years, Gravois Park’s data often exhibited the kind of spikes you still see in the the near northside neighborhoods. In recent years, the neighborhood has seen significant investment and interest. Having Cherokee as its southern border gave it a growing commercial district that drew attention and capital to the neighborhood. This was aided by the city investing significant money in rehabbing buildings in the area via the nonprofit developer Lutheran Development Group. This is a strategy that has worked well for the city in nearby neighborhoods, like Tower Grove East and others.
As the graph shows, the Bevo neighborhood continues to see strong price growth, meanwhile Carondelet and Gravois park have fallen behind the city’s overall rate of price growth. Notably, Gravois Park is actually showing declining prices. Sales prices in the neighborhood have dropped by almost 10%, meaning the neighborhood's real estate market is doing quite poorly, when compared to the city’s overall rate of growth IT stands as a cautionary tale that trends are not guaranteed. While Gravois Park’s prices began this graph toward the low end, they had climbed to at or near the top. The past year’s sales price history points toward a broken trend upward. That said, it is entirely possible that a return of lower interest rates will bring more rehabbing into the neighborhood.
Established neighborhoods holding value
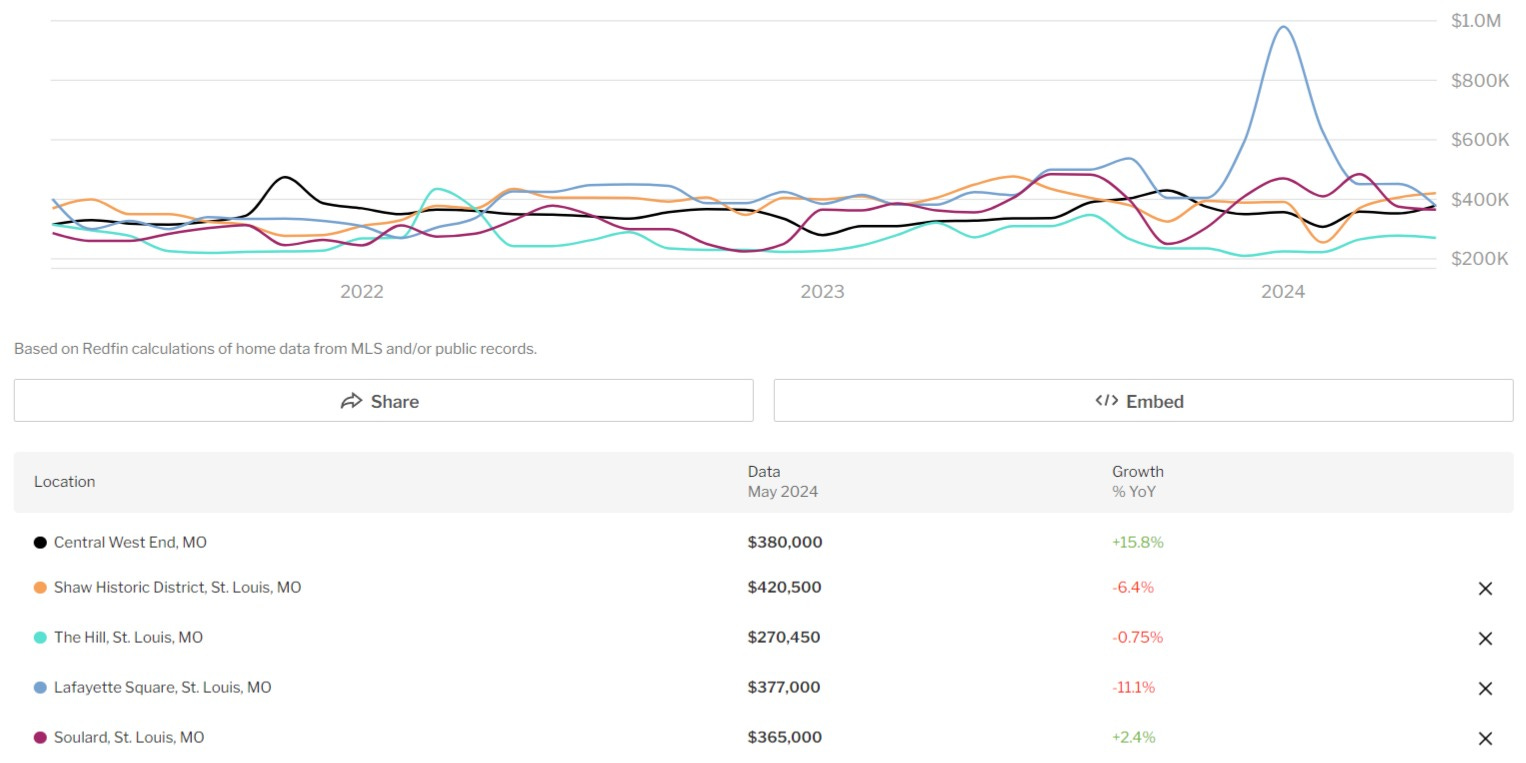
Next, we’ll turn our attention to a basket of city neighborhoods that are largely considered stabilized, middle/upper middle class neighborhoods. First off, let’s look at two neighborhoods that have grown to be very prosperous: the Central West End and Shaw. In recent years, the CWE’s price increases have been moderating. This year seems to mark a bit of a return to form, with CWE prices increasing 15% (YoY). This far exceeds the city’s average and shows that the neighborhood is helping hold up overall city sales price numbers. To the south, Shaw continues to hold strong prices, though they do show a bit of YoY weakness. The declining prices in Shaw are exceeded by the fall in YoY prices in the Lafayette Park neighborhood, while The Hill shows YoY prices are essentially even. Meanwhile, pricing in Soulard seems to closely match the city’s overall pricing trend.
A look at northern neighborhoods
To the north, we see YoY price increases in many neighborhoods. Comes with the caveat that prices are highly depressed and that these increases often only represent a change in price of a few thousand dollars, even when YoY percentage changes are high. That said, price growth appears to be fairly widespread. Current data shows Penrose, Walnut Park, Wells-Goodfellow and Baden all posting double digit price growth. Out of this basket of neighborhoods, only O’Fallon Park is showing falling YoY sales prices. That said, it appears that this is driven by one of the spikes that is seen in areas where rehabbing is happening amid a market with few sales prices. Whether this fall in sales price is a trend or an anomaly will take more time to see.
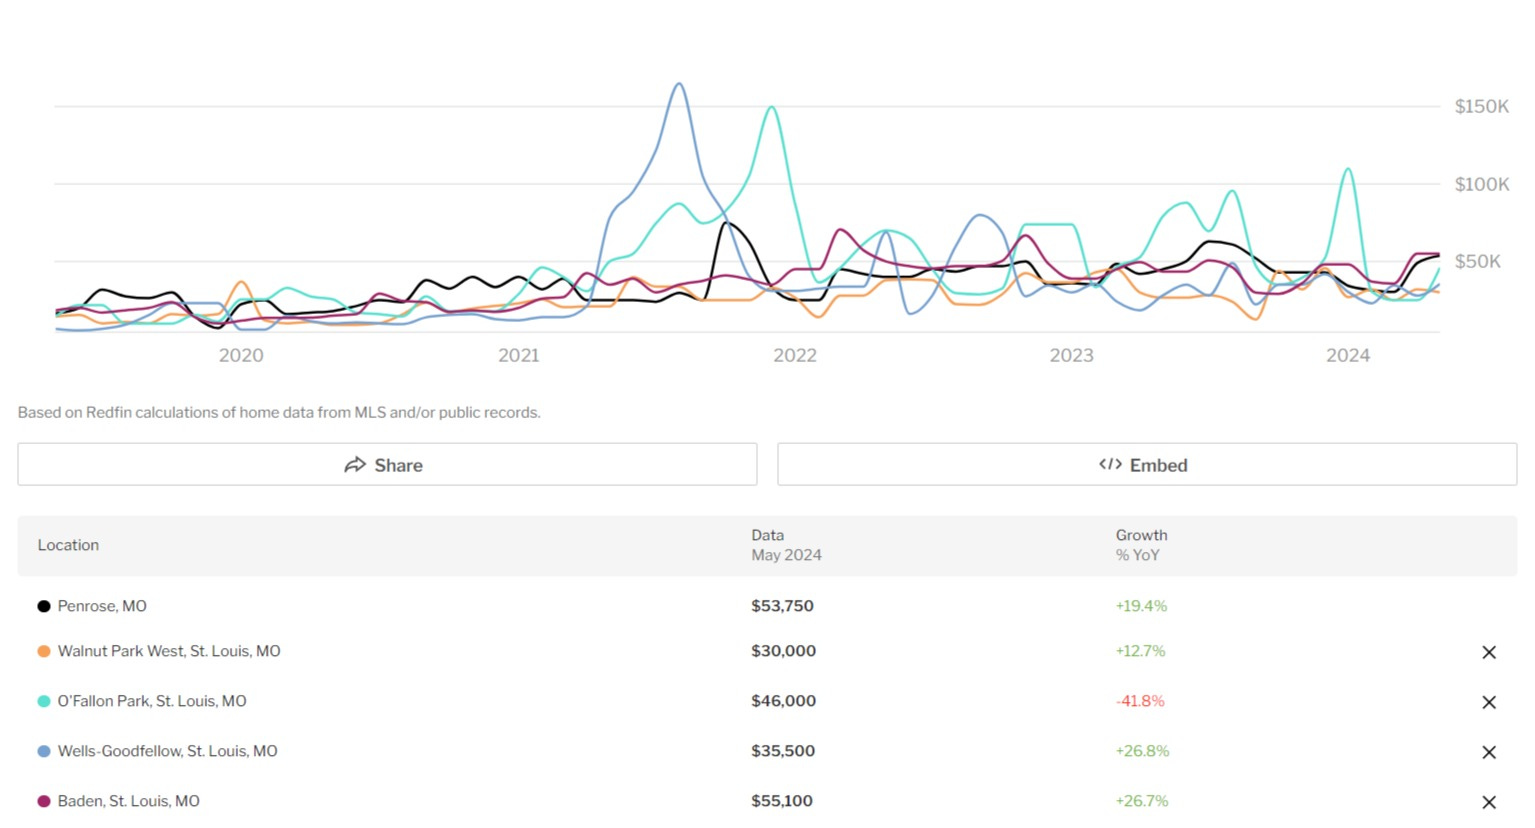
Overall, you can see that these neighborhoods sport sales prices at a fraction of the up-and-coming neighborhoods, while some neighborhoods’ average sales prices are roughy a tenth of those in higher cost neighborhoods like Shaw, CWE, etc.
Turning our attention to the Central Corridor
In recent years, the city’s Central Corridor neighborhoods have led the city’s building and construction scene. With new towers rising in the city's center, it is obvious that significant capital has been attracted to the area. It is also notable that there have been major commercial additions and the new soccer stadium in Downtown West also drawing attention and capital to parts of town that had seen less growth in the last decade. Let’s see how this has impacted recent sales prices in the area.
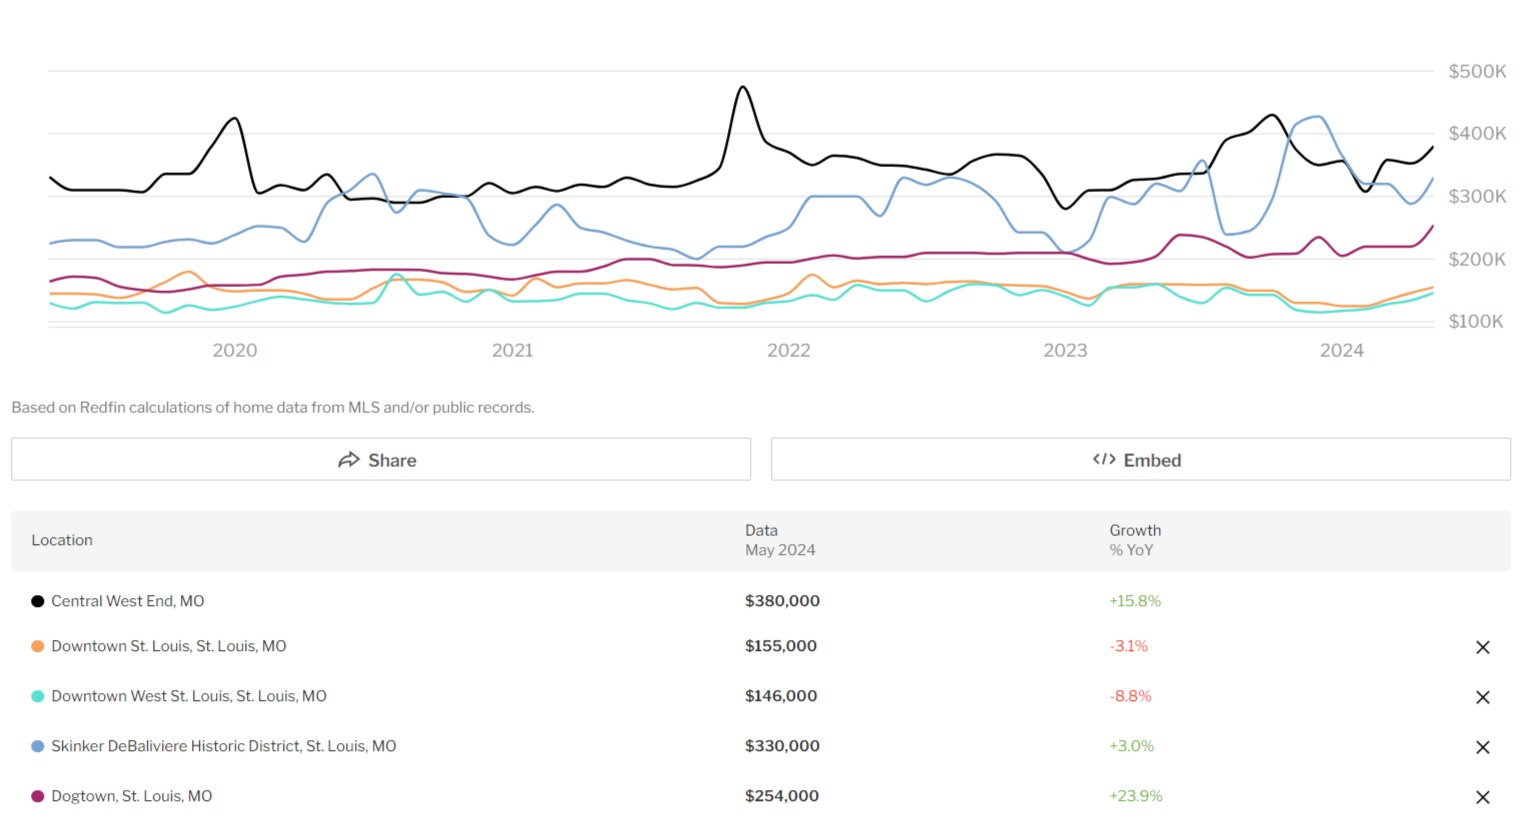
As you can see, the Central West End and Dogtown are seeing strong price growth, while other neighborhoods have not. Skinker-Debaliviere, which has seen significant new investment is growing at roughly the same rate as the overall city, while Downtown and Downtown West have been seeing price decreases, with the biggest coming in Downtown West. This flies in the face of the local media and political class’ mantra that weakness in Downtown’s central business district is offset by growth in Downtown West. While there is definitely commercial growth in the blocks around the soccer stadium, home sale price data indicates that this has not translated into higher prices for condos, etc. in the Downtown West Neighborhood. Really, the standout is Dogtown, which sits at the southern edge of the city’s central neighborhoods and is exceeding the CWE’s rate of price growth. Compared to other neighborhoods in this basket, the rate of price growth in Dogtown is also more even, with fewer hills and valleys. This is a sign of a very mature and stable property market.
Southern neighborhoods show both weakness and strength
Looking at neighborhoods to the south, we see another mixed bag. While none of these neighborhoods are facing double digit price decreases, Dutchtown, South Hampton, and St. Louis Hills all saw very modest decreases. As readers can see, Dutchtown prices remain depressed, as much of the neighborhood remains without recent investment. South Hampton and St. Louis Hills are both established neighborhoods, so it is somewhat of a surprise to see that they are underperforming the city as a whole. That said, St. Louis Hills pricing is still almost even with the CWE’s formidable price tags.
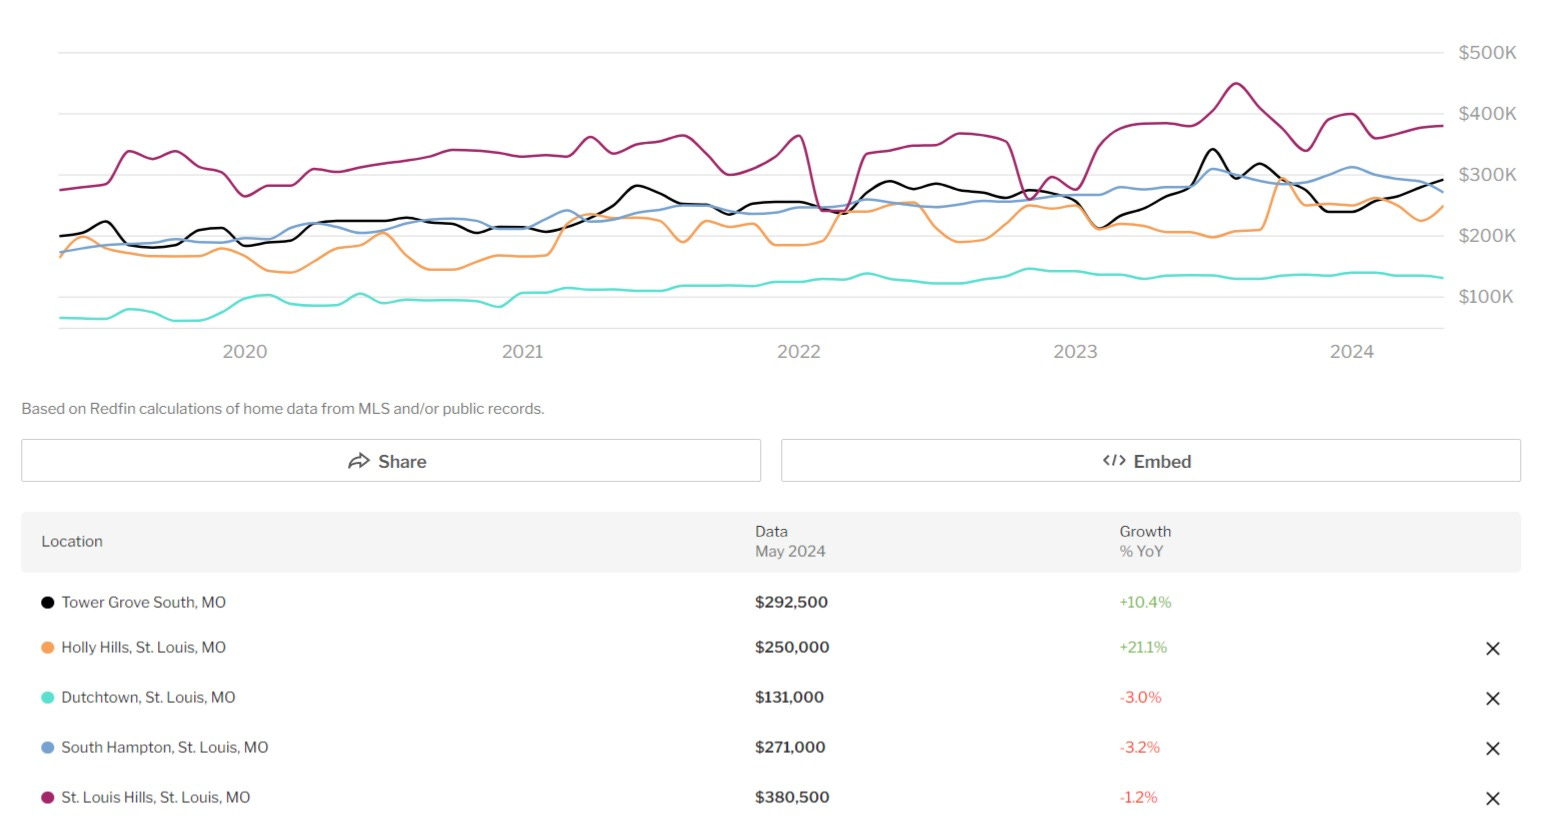
One interesting phenomenon that highlights the hyper-locality of real estate pricing is that Dutchtown’s neighbors are doing quite well. To Dutchtown’s south, Holly Hills has seen YoY price increases that exceed 20%, while northwestern neighbor Tower Grove South’s 10% price increase puts it well ahead of the city as a whole. Overall, southern neighborhoods’ pricing shows that many of these neighborhoods’ values are holding up, with nobody in this basket dropping by double digits.
A real mixed bag
It shouldn’t really surprise anybody who has lived in the city for some time, but our real estate values continue to go from very, very low to quite high. Much of this is related to the racial makeup of the neighborhoods and our nation’s longstanding practice of undervaluing property in non-majority-white communities. There are also what appear to be shifts in investment patterns. While the last decade saw lots of effort and money being expended to redevelop the southern “state street” neighborhoods, including both Gravois Park and Dutchtown, some of these neighborhoods have seen declines in sales prices. Meanwhile, there is a lot of energy and money being put into the near northside neighborhoods that border the CWE and Skinker-Debaliviere neighborhoods, with the “Maker District” regularly announcing new retail and dining additions. While it is too early to tell, this could indicate that investment is shifting away from the state streets and into the near northside. If pricing and investment in the state street neighborhoods doesn’t rebound, it could mean that the neighborhoods’ real estate markets weren’t as stabilized as many thought. While nice rehabs in both neighborhoods are still fetching good prices, if investment flows don’t return south, these neighborhoods could continue to see declining prices, especially in non-updated homes brought to the market. We will have to wait and see if this turns into a longer term trend.
At the same time, the Central Corridor shows both strength to the west and weakness to the east, while prices in many northern neighborhoods have seen stability with some signs of increasing prices. At the same time, many see significant difficulty in sustaining an average sales price that exceeds $50k. While West End and Academy are seeing prices really rise, this trend does not seem to stretch further north, where most neighborhoods are having a hard time breaking that $50k mark with any consistency. All-in-all we are seeing some city real estate trends holding strong, while new ones appear to be emerging.